Grid Search Launch
Note
Click here to download the full example code or to run this example in your browser via Binder
Grid Search Launch#
Author: Chaithya G R
In this tutorial we will use the pysap-mri’s launch grid helper function to carry out grid search. We will search for best regularisation weight and the best wavelet for reconstruction. For this the search space works on : mu ==> 5 Values on log scale between 1e-8 and 1e-6 Wavelets ==> sym8 and sym12 nb_scale ==> 3 and 4
Imports
from mri.operators import FFT, WaveletN
from mri.operators.utils import convert_mask_to_locations
from mri.reconstructors import SingleChannelReconstructor
from mri.scripts.gridsearch import launch_grid

from pysap.data import get_sample_data

from modopt.math.metrics import ssim
from modopt.opt.proximity import SparseThreshold
from modopt.opt.linear import Identity
import numpy as np
import matplotlib.pyplot as plt
Load MR data and obtain kspace
image = get_sample_data('2d-mri')
mask = get_sample_data("cartesian-mri-mask")
kspace_loc = convert_mask_to_locations(mask.data)
fourier_op = FFT(samples=kspace_loc, shape=image.shape)
kspace_data = fourier_op.op(image.data)
Define the keyword dictionaries based on convention
ref = image
metrics = {
    'ssim': {
        'metric': ssim,
        'mapping': {'x_new': 'test', 'y_new': None},
        'cst_kwargs': {'ref': image, 'mask': None},
        'early_stopping': True,
    },
}
linear_params = {
    'init_class': WaveletN,
    'kwargs':
        {
            'wavelet_name': ['sym8', 'sym12'],
            'nb_scale': [3, 4]
        }
}
regularizer_params = {
    'init_class': SparseThreshold,
    'kwargs':
        {
            'linear': Identity(),
            'weights': np.logspace(-8, -6, 5),
        }
}
optimizer_params = {
    # Just following convention
    'kwargs':
        {
            'optimization_alg': 'fista',
            'num_iterations': 20,
            'metrics': metrics,
        }
}
Call the launch grid function and obtain results
raw_results, test_cases, key_names, best_idx = launch_grid(
    kspace_data=kspace_data,
    fourier_op=fourier_op,
    linear_params=linear_params,
    regularizer_params=regularizer_params,
    optimizer_params=optimizer_params,
    reconstructor_class=SingleChannelReconstructor,
    reconstructor_kwargs={'gradient_formulation': 'synthesis'},
    compare_metric_details={'metric': 'ssim'},
    n_jobs=-1,
    verbose=1,
)
image_rec = raw_results[best_idx][0]
Out:
Total number of gridsearch cases : 20
The best result of grid search is: ('sym8', 4, <modopt.opt.linear.base.Identity object at 0x7f3a4ed09f30>, 3.162277660168379e-07, 'fista', 20, {'ssim': {'metric': <function ssim at 0x7f3a4edd6dd0>, 'mapping': {'x_new': 'test', 'y_new': None}, 'cst_kwargs': {'ref': <pysap.base.image.Image object at 0x7f3a4ed096c0>, 'mask': None}, 'early_stopping': True}})
The best value of metric is : 0.8530240606880823
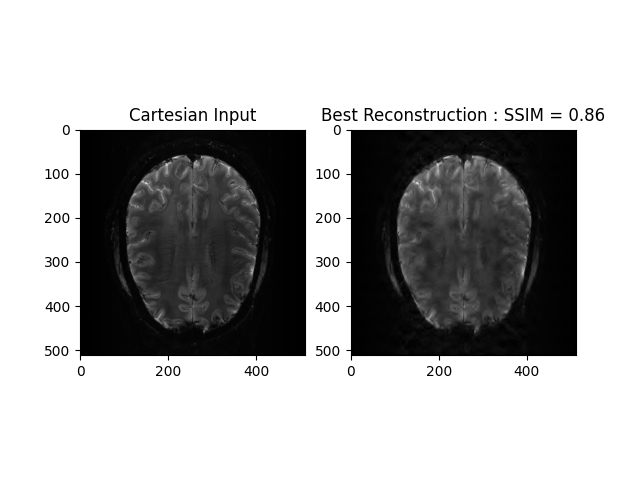
View Best Results
recon_ssim = ssim(image_rec, ref)
plt.subplot(1, 2, 1)
plt.imshow(np.abs(image), cmap='gray')
plt.title("Cartesian Input")
plt.subplot(1, 2, 2)
plt.imshow(np.abs(image_rec), cmap='gray')
plt.title('Best Reconstruction : SSIM = ' + str(np.around(recon_ssim, 2)))
plt.show()
Out:
/volatile/Chaithya/actions-runner/_work/pysap/pysap/examples/pysap-mri/gridsearch_launch.py:98: UserWarning: FigureCanvasAgg is non-interactive, and thus cannot be shown
  plt.show()
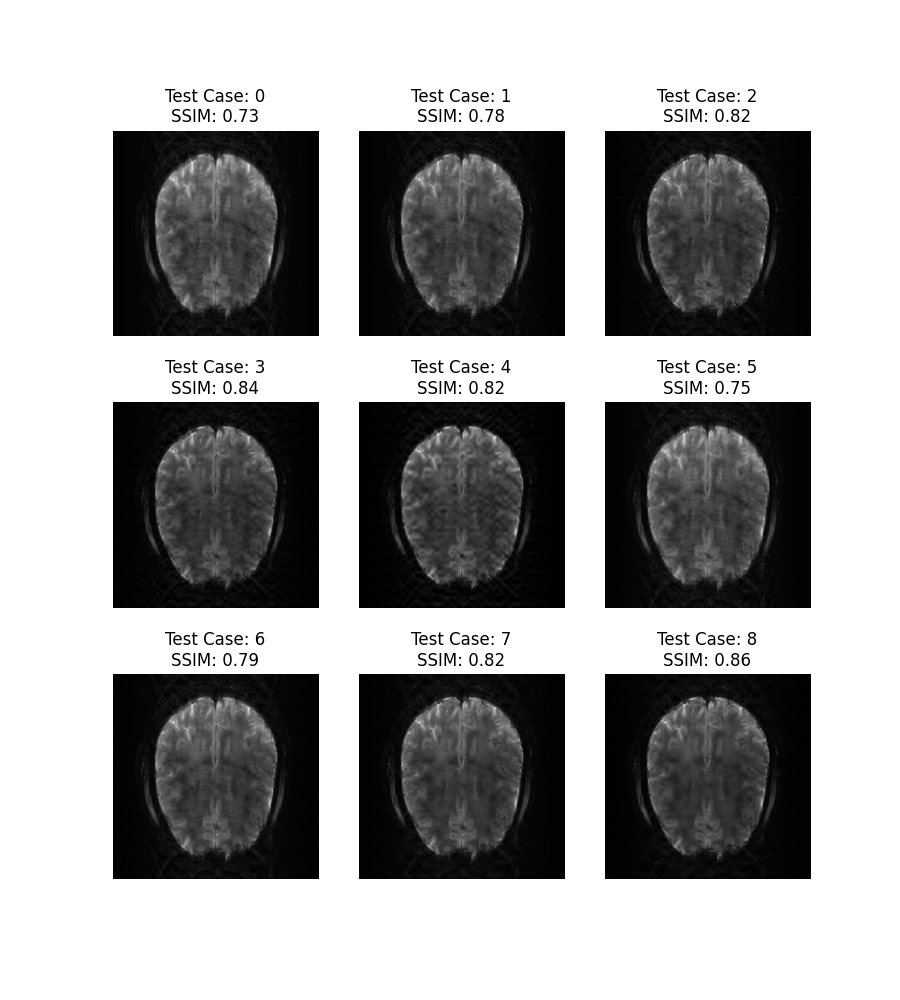
View other reconstruction Results
plt.figure(figsize=(9, 10))
for i in range(9):
    plt.subplot(3, 3, i+1)
    recon = raw_results[i][0]
    test_case = test_cases[i]
    plt.imshow(np.abs(recon), cmap='gray')
    plt.axis('off')
    recon_ssim = ssim(recon, ref)
    plt.title("Test Case: " + str(i) + "\nSSIM: " + str(np.around(recon_ssim, 2)))

plt.show()
Out:
/volatile/Chaithya/actions-runner/_work/pysap/pysap/examples/pysap-mri/gridsearch_launch.py:112: UserWarning: FigureCanvasAgg is non-interactive, and thus cannot be shown
  plt.show()
Total running time of the script: ( 0 minutes 17.554 seconds)